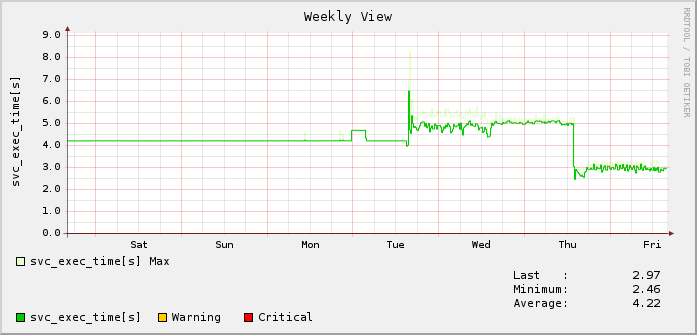
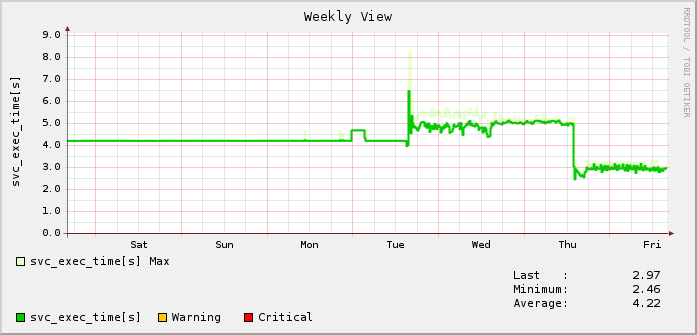
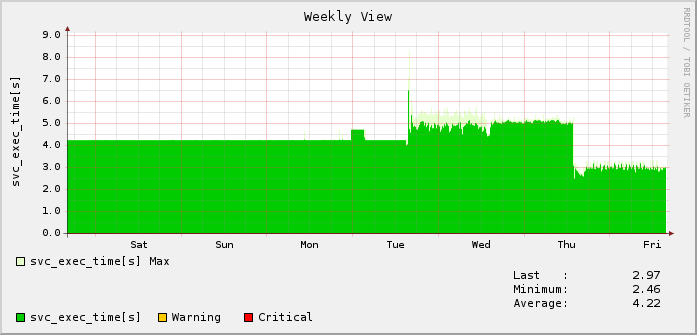
The following describes the settings for Configuration > System > Performance Graph Settings in detail. These settings affect.
- Appearance of the performance graphs in the User Web Interface, like size, color and type of plot
- Creation of RRD files and lifetime of the stored values
- Contents of graph like plotting a MAX or LAST value
Performance Data Collection - RRD
Performance data is collected and stored in Round Robin Database files, so called RRDs. The files have a fixed size and thus a fixed number of data slots. Older data is rotated and the oldest data slow is deleted from the file as soon as new data flows in. This does not mean that measurements are lost, it rather means that measurement of the farer past are not as tight as measurements from the last week.
Therefore data is saved in two containers:
- high resolution container
- low resolution container
Each container holds data of a fixed amount of time but with different resolutions.
Export
Performance data cannot be exported out of the both but with the Data-Exporter Addon. See the Data-Exporter article for detailed information.
Graph Types
Three different graph types are available. The LINE types should be used for measurements with drops and peaks where area is the better choice measures such as disk usages.
You can configure the type either globally here or you can override the global value on a service base with the service setting Performance data type
Thin Line - LINE1
Thick Line - LINE2
Filled Area - AREA
Settings
The following table explains all settings in detail.
Setting | Description |
|---|---|
| Graph type: | Global graph type which is used if nothing different was specified. |
| High resolution data interval (minutes): | |
| High resolution data pool size (days): | |
| Low resolution data interval (minutes): | |
| Resolution for MAX values (items): | |
| Low resolution data pool size (years): | |
| Graph width (px): | |
| Graph height (px): | |
| Color for MAX of first value: | |
| Color for MAX of second value: | |
| Color for first value: | |
| Color for second value: | |
| Color for LAST value: | |
| olor for WARNING: | |
| Color for CRITICAL: | |
| Plot MAX value: | |
| Plot LAST value: | |
| Debug Level: | Download Logfile |
| Warning threshold for RRD disk usage (Gb): | |
| Critical threshold for RRD disk usage (Gb): | This option allows you to control the maximum amount of time in seconds that host and service check result "reaper" events are allowed to run. "Reaper" events process the results from host and service checks that have finished executing. If there are a lot of results to process, reaper events may take a long time to finish, which might delay timely execution of new host and service checks. This variable allows you to limit the amount of time that an individual reaper event will run before it hands control back over to Nagios for other portions of the monitoring logic. |
| Retention file update interval in minutes * | This setting determines how often (in minutes) that Nagios will automatically save retention data during normal operation. If you set this value to 0, Nagios will not save retention data at regular intervals, but it will still save retention data before shutting down or restarting. |
| Max concurrent checks * | This option allows you to specify the maximum number of service checks that can be run in parallel at any given time. Specifying a value of 1 for this variable essentially prevents any service checks from being run in parallel. Specifying a value of 0 (the default) does not place any restrictions on the number of concurrent checks. You'll have to modify this value based on the system resources you have available on the machine that runs Nagios, as it directly affects the maximum load that will be imposed on the system (processor utilization, memory, etc.). |
| Max check spread time in minutes * | This option determines the maximum number of minutes from when Nagios starts that all services (that are scheduled to be regularly checked) are checked. This option will automatically adjust the service inter-check delay method (if necessary) to ensure that the initial checks of all services occur within the timeframe you specify. In general, this option will not have an affect on service check scheduling if scheduling information is being retained using the use_retained_scheduling_info option. Default value is 30 (minutes). |
| Status update interval in seconds * | Determines after how many seconds the global status file should be updated. Increase this to achieve faster alert appearance, especially when using time critical checks like MODBUS dry contact checking or access control. |
| Use RAM Disk for Status | Saves the status data in a RAM disk if enabled. Disabling this option is recommended for large installations where status data files may reach large sizes. |
| Enable Environment Macros | Set environment variables and macros for runtime components like plugins, event handlers, notifications and the like. Disable this option if you're not sure if you use these macros. Disabling it increases performance and avoids higher latencies. |
| Use Large Installation Tweaks | Allows monitoring process to use different shortcuts in order to increase performance and avoid higher latencies and it disables the automatic backup creation upon reboot. Set this option during upgrades and maintenance works where reboots are required as it avoids the autobackup creation upon boot and speeds up the boot process. This option is highly recommended for most installations and can be safely activated. |
| Monitoring Debug Level | Enable this for detailed debug information of the monitor process. This should only be enabled for troubleshooting and is considered for experts. Leave it disabled if not otherwise advised. If enabled you can see debug information in the log file Admin GUI > Status > Logs > Monitor Process (Debug) [daaz_debug.log]. Choose which details shall be included in the log, the more you enable the more system resources are required for logging and the more it is likely for the log file to get flooded.
|
| Enable Support File Creation | Enables the creation of support files in the background every minute. This is intended for troubleshooting and investigation. The support files can then be downloaded in Status > Summary > Click here to create support file archive |
| Maximal Number of Support Files | Specifies the number of files which shall be created every minute, so if 60 is specified the SONARPLEX would create files for the last hour. |
Related Articles


