Introduction
This page covers the first steps after you've installed the azeti Site Controller on your edge device. It will show you how to start and stop the system, connect to the middleware and getting started in the azeti Control Panel. The next steps are the basic ones and will not cover advanced topics like TLS encryption or special configuration tweaks.
The following instructions assume that you changed into the Site Controller base directory, typically:
root@raspberrypi /home/pi # cd /opt/azeti/SiteController/
root@raspberrypi /opt/azeti/SiteController #
Configure Access to the azeti Engine
The Engine is the central point of contact for all Site Controller instances. It provides the control and configuration user interface as well as dashboards and reporting. Each Site Controller has to be configured with the right Engine credentials.
You will need the following mandatory information for the configuration (ask your Engine Administrator or Hoster).
user_id(MQTT broker username)pass(MQTT broker password)host(MQTT destination host, IP of azeti Engine/)organizationShortName(Short name of the Organization where the broker user was created in)
Alter the SiteController.cfg and set the credentials accordingly.
[ExternalBroker]
host = broker.azeti.net
port = 1883
...
user_id = broker_username@example.com
password = VerySecretPasswordGoesHere
organizationShortName = azeti
tls_enable = False
...
Starting the system
The Site Controller is controlled by the central start script.
Start the Site Controller, it will start the mosquitto automatically if necessary
root@ubuntu:~# /opt/azeti/SiteController/run_SiteController.py start
- Verify that everything runs fine after you started the Site Controller. Running modules will be highlighted green and labelled as running with. The status command also shows your configured broker username and the destination URL, double check to make sure these are correct.
root@raspberrypi /opt/azeti/SiteController # ./run_SiteController.py status
Time zone set to: Etc/UTC
Serial of this installation: raspi-test-sebastian
Main version of this installation: 1.2.0
Host type: RasPi
External Broker set to: azetibroker02.azeti.net:1883, TLS disabled
Checking installation ...
OK: Integrity check passed.
OK: Module mosquitto is running with PID (2175)
OK: Module Watchdog.py is running with PID (2355)
OK: Module cloudConnector.py is running with PID (2388)
OK: Module HD2CloudExporter.py is running as sub thread of cloudConnector.py with PID (2388)
OK: Module ConfigProvider.py is running with PID (2489)
OK: Module RawResultsDeMux.py is running with PID (2595)
OK: Module CalibResultsEvaluator.py is running with PID (2609)
OK: Module JobProcessor.py is running as sub thread of cloudConnector.py with PID (2388)
Stopping the system
This command stops all site controller modules.
root@raspberrypi /opt/azeti/SiteController # ./run_SiteController.py stop
Access the new Location in azeti Control Panel
Now we can go to the web based azeti Control Panel and access our newly created location.
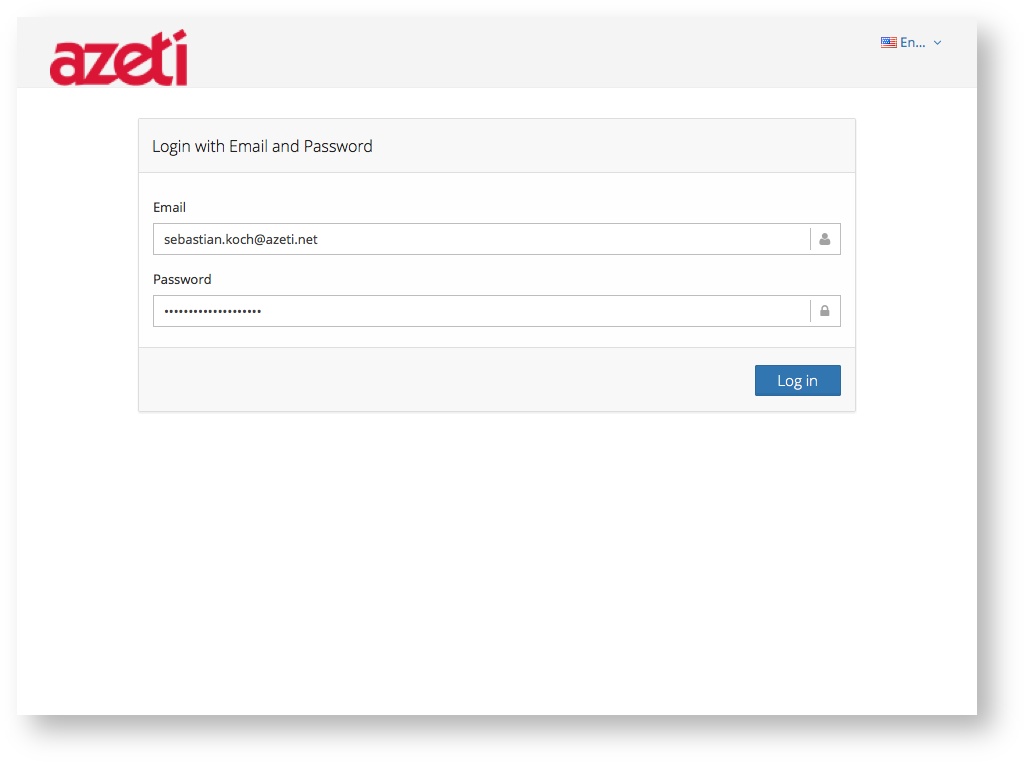
- Open your azeti Control Panel in your browser, URL will be similar to https://azeticloud02.azeti.net/SSCAdmin
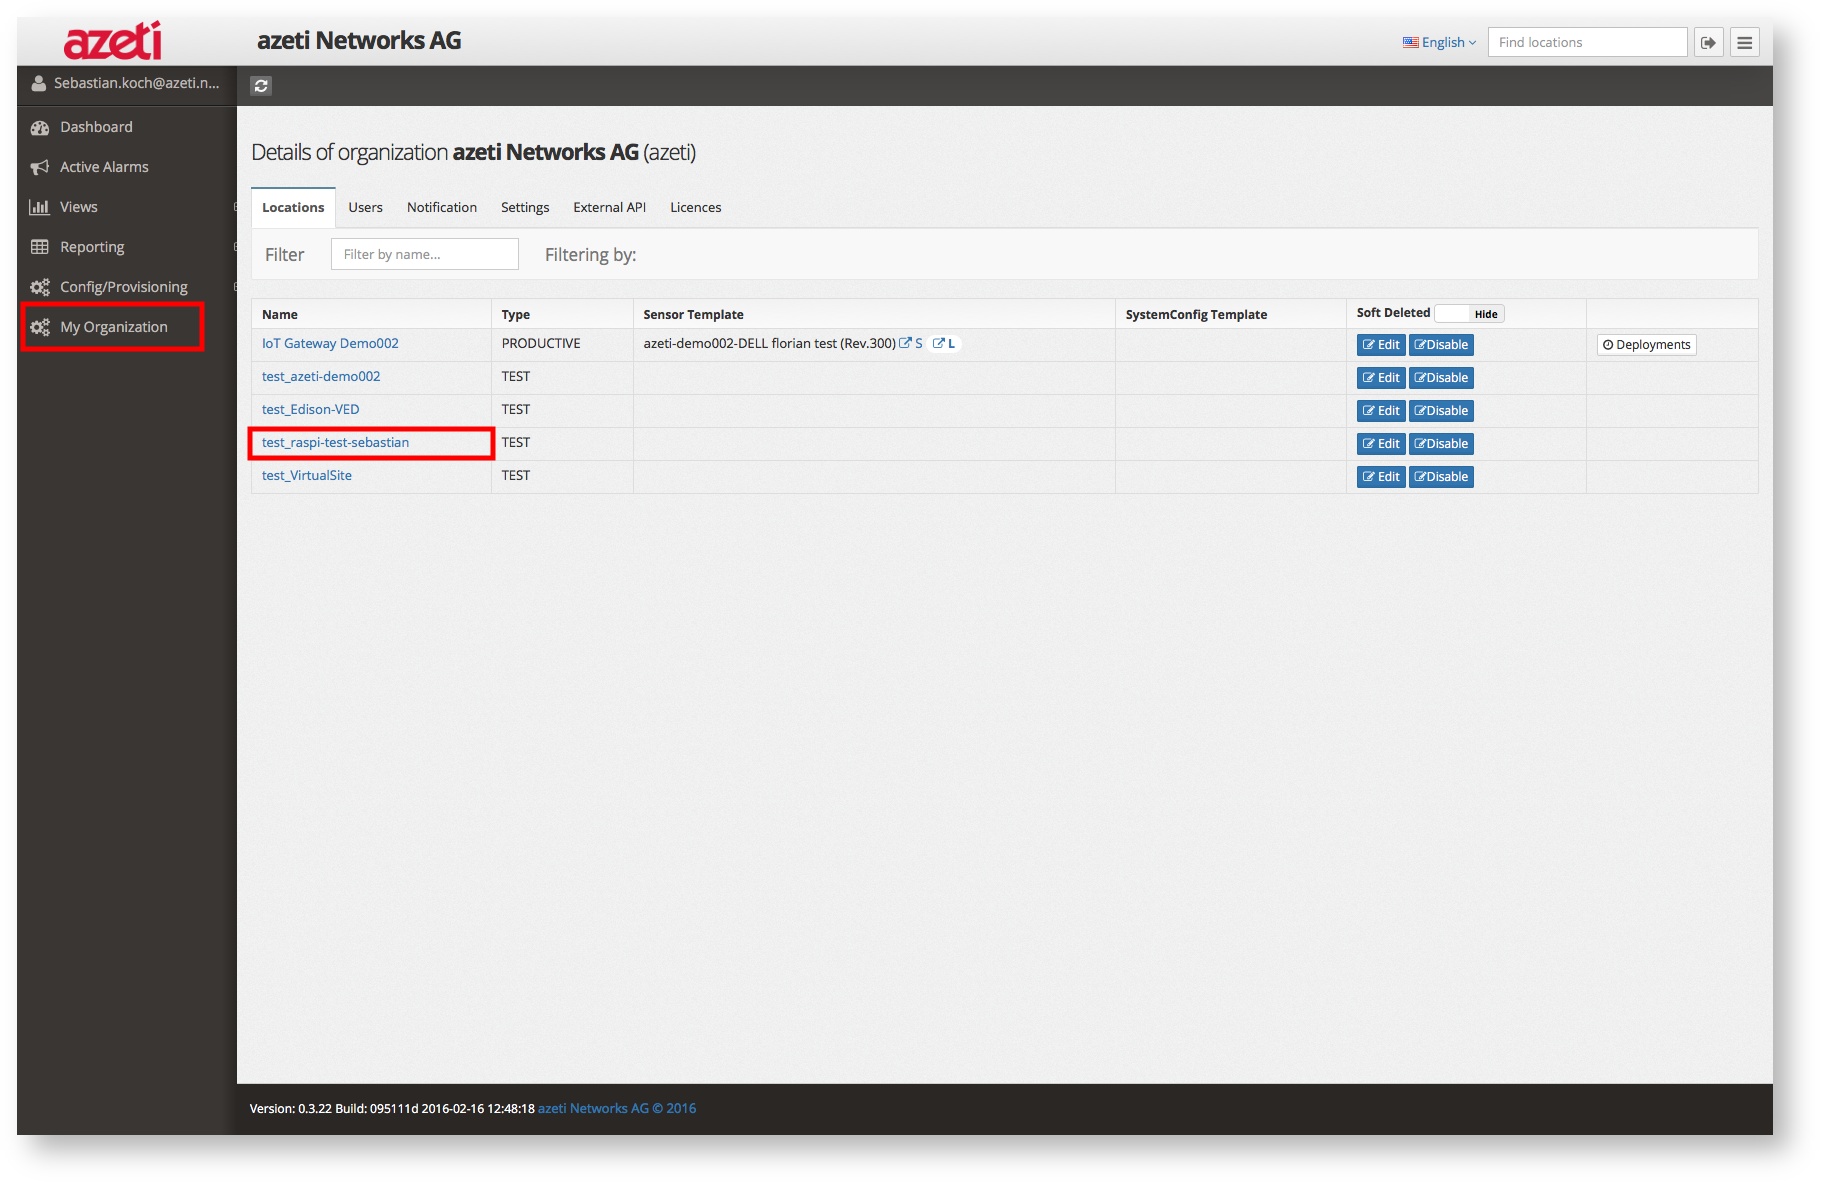
- Navigate to My Organization and to the Locations where you will find your new location, prefixed with a test_, e.g. test_raspi-test-sebastian
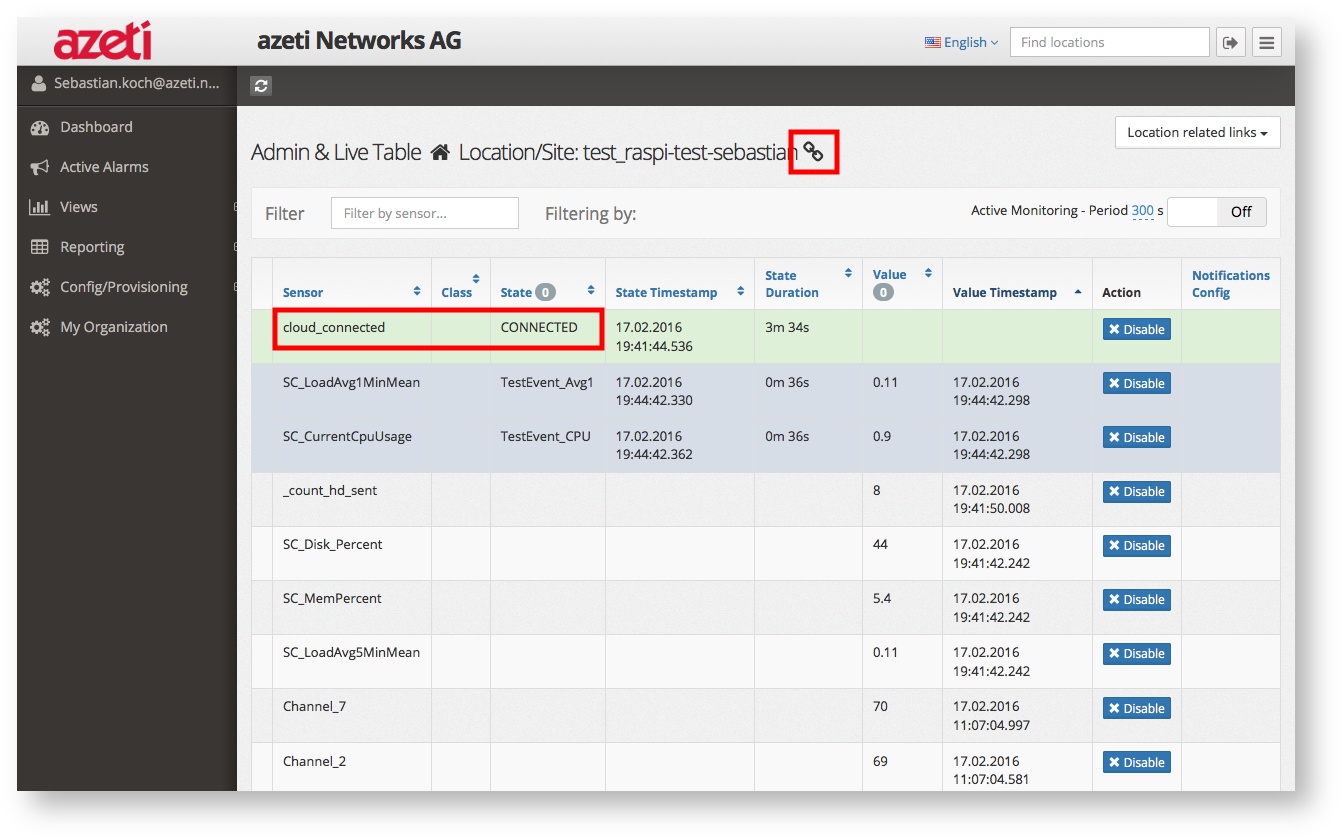
- Click on the location link, which opens the Admin Live Table that is showing live raw sensor readings.
- You will see the CONNECTED status in sensor cloud_connected as well as a small chain symbol showing that your location properly communicates with the azeti Middleware
Finally you will now be able to see live data flowing in to the azeti Control Panel.


