| Section | ||||||||||||||||||||||||||||||||
|---|---|---|---|---|---|---|---|---|---|---|---|---|---|---|---|---|---|---|---|---|---|---|---|---|---|---|---|---|---|---|---|---|
|
Formatting Guidelines
Parameters are unfortmatted
Paths to directories or files are preformatted /opt/azeti/SiteController/foobar
| Tip | |||||
|---|---|---|---|---|---|
Enclose parameters and paths into double brackets
when typing and Confluence automatically applies the preformat style. |
Right: Headings use Capitalization for Nouns and Important Information and Words 4+ Letters
Wrong: Headings use capitalization for nouns and important Information and words 4+ letters
Writing Instructions
Instructions are numbered lists and links in the software are bold with arrows (dash plus > becomes: → ):
- Open Components → Edit and set your new component name
- Choose Lorem Ipsum and do something
XML snippets go into a code bracket with type XML: {code:xml} (this will insert a code macro here) like this:
...
<here is some></here is some>Screenshots
Screenshots use a Drop Shadow effect which can be accessed by Edit → Properties
Writing Best Practice
...
Accessing the views
There are different ways to access the views:
- Through the left menu: go to Views and expand the Organization (for Organization Views) or User (for User Views). If the view is a a multisite view the selection tree will be shown to select the correct location
- Through the location tree
- Through the dashboard map
Creating a View
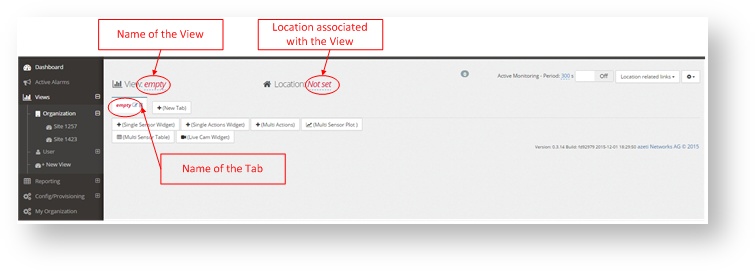
To create view click on +New View on Views
Once done that fill the name of the view, the location associated with the view and the name of each tab that will be set. Create as many tabs as needed.
Widgets
On the views the data is shown in widgets. T
Types
The widgets can be off the following types
Single sensor widget
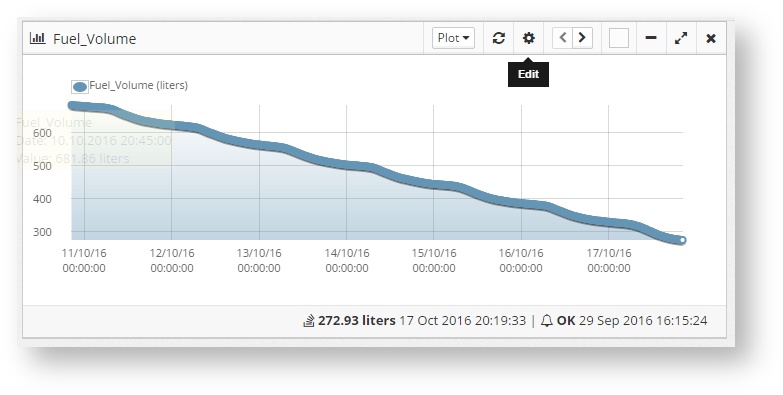
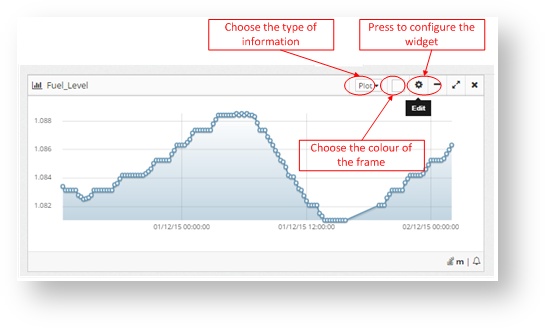
Shows only the values of one sensor. It can show the state, a list of values, a graph (plot) or a historic graph history. Select them by using the drop down on the top of the widget
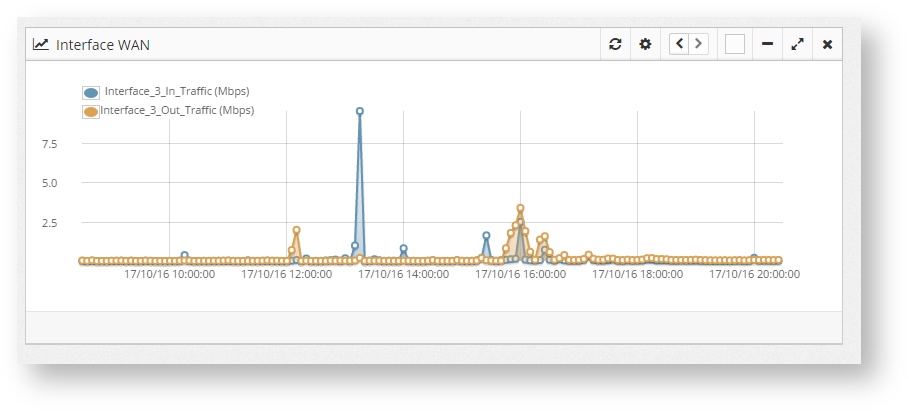
Multi sensor plot
Shows the graph for different sensors on the same widget
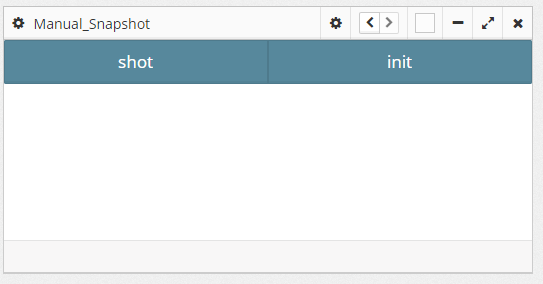
Single Actions
Shows a button for the corresponding configured action
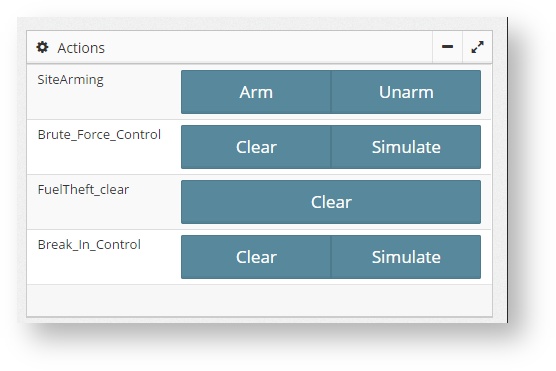
Multi Actions
Shows several buttons for multiple actions
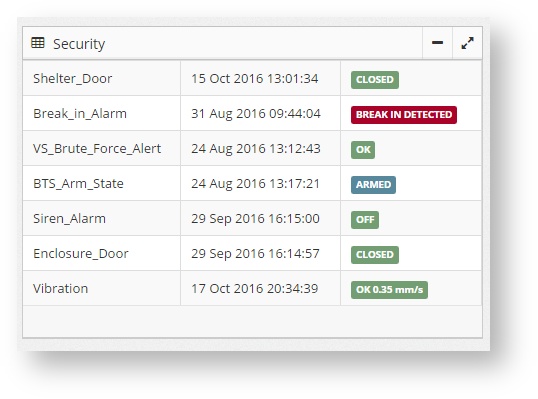
Multisensor table
Shows the state and/or value of several sensors under the same widget
Widget Configuration
Once the Widget is added, it can be configured by pressing the config button on the top right corner.
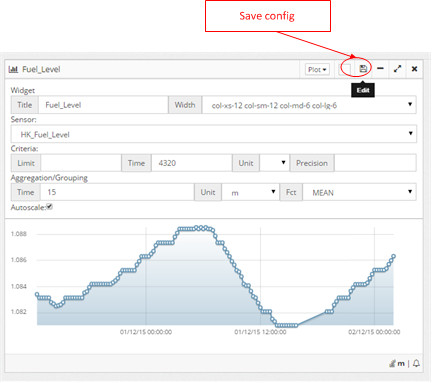
After pressing that button, configure the widget and hit save:
In the config of the widget it is necessary:
- The width of the widget
- The Title
- The sensor (or sensors) from which the data will be taken
- The criteria to limit the size of the data
- Grouping info for the Plot type. With this the data can be grouped by periods of time through different methods, like the average (mean), maximum, minimum, etc.
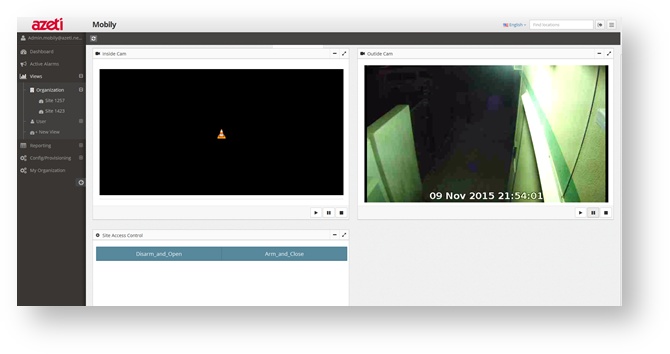
Live Video Widget
One special kind of widget is the Live Video one. This only work with the WebVLC plugin. To configure it the user must include the RSTP/RTP URL of the stream from the camera that wants to show.
Once configured and saved, the user only has to press the play button to start to watch the live video stream.
| Warning |
|---|
The live video widget only works with Mozilla Firefox (v39 or later) or Safari (version 9 or later). The VLC plugin needs to be installed in the computer playing the video, and direct IP connectivity needs to be present from the user computer and the camera. |
