| Section | ||||||||||||||||||||||||||||||
|---|---|---|---|---|---|---|---|---|---|---|---|---|---|---|---|---|---|---|---|---|---|---|---|---|---|---|---|---|---|---|
|
Formatting Guidelines
Parameters are unfortmatted
Paths to directories or files are preformatted /opt/azeti/SiteController/foobar
| Tip | |||||
|---|---|---|---|---|---|
Enclose parameters and paths into double brackets
when typing and Confluence automatically applies the preformat style. |
Right: Headings use Capitalization for Nouns and Important Information and Words 4+ Letters
Wrong: Headings use capitalization for nouns and important Information and words 4+ letters
Writing Instructions
Instructions are numbered lists and links in the software are bold with arrows (dash plus > becomes: → ):
- Open Components → Edit and set your new component name
- Choose Lorem Ipsum and do something
XML snippets go into a code bracket with type XML: {code:xml} (this will insert a code macro here) like this:
...
<here is some></here is some>Screenshots
Screenshots use a Drop Shadow effect which can be accessed by Edit → Properties
Writing Best Practice
...
Alarms list information
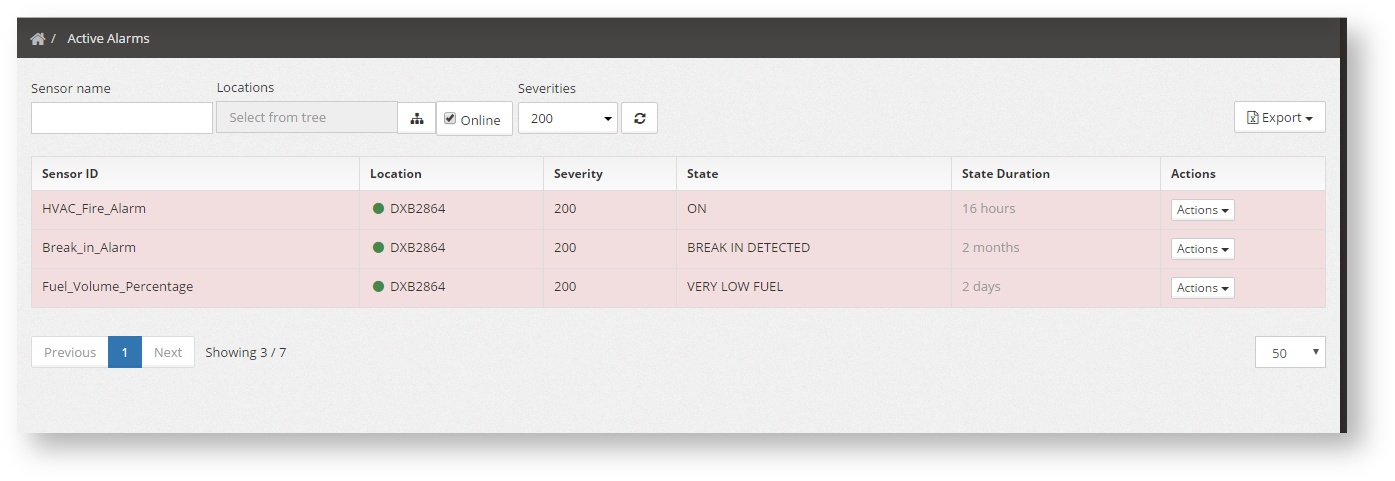
The alarm list shows all the live alarms in a table that changes in real time (no need for refreshing the page).
The list shows:
- The sensors ID: The sensor name that has triggered the alarm
- The location name and connection status (green online, red offline)
- The severity of the sensor (see Terms & Concepts)
- The state of the sensor when it triggered the alarm
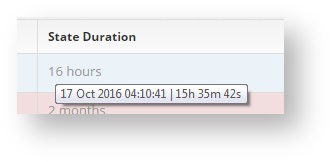
- How long has the alarm been active. Hover over the state duration to see the exact timestamp of the alarm
Filtering
The alarm list can be filter using the options at the top of the page. These are:
- Sensor name: Partial or complete sensor name. Case sensitive
- Locations: pressing the button will show the location tree that allows to filter the alarms by location or region (as defined on the location tree)
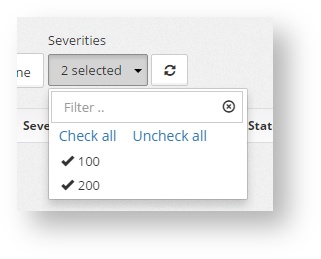
Severity: It indicates the number from which all alarms with equal or less severity will be filtered. So to see alarms of severity 100 or above the user would have to input the number 100. By pressing there the system will already show the posible severities available based on the sensor
Actions and Drill Down
By pressing on the button "Actions" on each alarm, the user can go to other screens to get more information about the cause of the alarm.
This links are:
- The Admin & Live Table
- The location Event Log (see Reporting)
- The location Event log already filtered for that specific sensor
Exporting
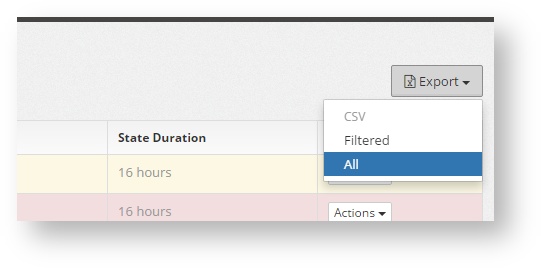
At any point the table that is being shown can be exported to CSV file using the "Export option". Select Filtered to only export the alarms being shown at that moment (with the filter applied) or all for the whole list (without filters)
Example: Show the list of disconnected sites
To show the list of current disconnected sites use this filter:
- Sensor: cloud_connected
- Severitiy: 100 and 200


