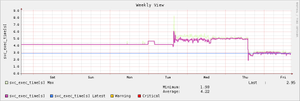
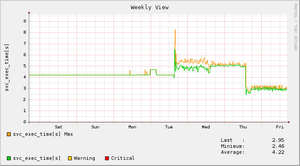
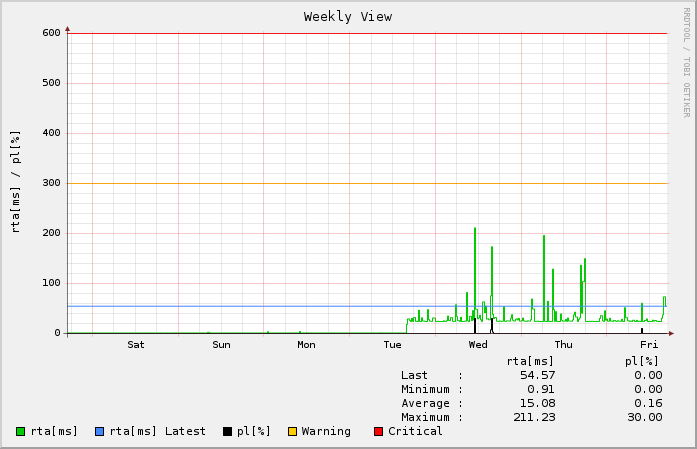
...
Setting | Description | ||
|---|---|---|---|
| Graph type: | Global graph type which is used if nothing different was specified. | ||
| High resolution data interval (minutes): | The lowest interval for stored data that is used for the AVERAGE during plotting. This should be as low as the lowest Normal Check Interval of any configured service to provide high accuracy. If this resolution interval is chosen larger than the Normal Service Check Interval the values will be averaged. | ||
| High resolution data pool size (days): | Time in days specifying how long values are stored in the low resolution data archive RRA (Round Robin Archive). | ||
| Low resolution data interval (minutes): | The lowest interval in minutes for the low resolution container. Specifies over how many minutes the collected data should be averaged and stored. | ||
| Resolution for MAX values (items): | The MAX resolution decides about how many values are taken to evaluate the maximum. The default is 3 so the maximum value out of 3 measured values is plotted (if it is enabled by [Plot MAX value]). | ||
| Low resolution data pool size (years): | Specified the number of years for storage of low resolution data. | ||
| Graph width (px): | Width of graphs in pixels
| ||
| Graph height (px): | Height of graphs in pixels | ||
| Color for MAX of first value: | Color for plotting the MAX values, use a bright color to visualize peaks. | ||
| Color for MAX of second value: | Color for the MAX value of the possible second measurement | ||
| Color for first value: | Color for the first value | ||
| Color for second value: | Color for the second value
| ||
| Color for LAST value: | Color for the horizontal line plotted for the LAST value of every graph. | ||
| Color for WARNING: | Color for horizontal WARNING threshold line | ||
| Color for CRITICAL: | Color for horizontal CRITICAL threshold line | ||
| Plot MAX value: | Enables or disables the plotting for the MAX value.
| ||
| Plot LAST value: | Enables or disables the plotting of the LAST value, helps you compare the last measurement against the average of the past | ||
| Debug Level: | Debug Level, should only be changed when necessary for troubleshooting | ||
| Warning threshold for RRD disk usage (Gb): | Threshold when the built-in service check RRD-Disk-Usage on the host -azeti-A- should turn into WARNING | ||
| Critical threshold for RRD disk usage (Gb): | Threshold when the built-in service check RRD-Disk-Usage on the host -azeti-A- should turn into CRITICAL |
Related Articles
| Filter by label (Content by label) | ||||||||||||||||
|---|---|---|---|---|---|---|---|---|---|---|---|---|---|---|---|---|
|


